Are Stocks a Random Walk?
July 19, 2009
A co-worker has been day-trading for the last few months, and I’ve been teasing him about the negative average returns of day traders. (Day traders always think that they have a deterministic way to end up on the winning side of average.) Last week he gave some explanation for recent stock behavior, and I reminded him that stocks just follow a random walk and that he wouldn’t be able to tell a stock graph from a random walk. He told me that he absolutely would, and the challenge was on.
(I learned later that he thought I meant a truly random graph, where each day is a random number. I don’t know whether he would have taken the challenge had he known that I was referring to a random walk, which is a value that goes up or down by some random amount each day.)
He said that a six-month interval would be easiest to distinguish, so I went for 130 days, which is the number of weekdays in six months. I generated six graphs of random walks with 130 samples. I also chose six stocks off the top of my head, downloaded their history from Yahoo Finance, and for each one picked a random six-month interval. I then normalized all twelve graphs vertically.
The next day I gave him the twelve printouts and asked him to separate them into two piles: stocks and random. Other people got interested and gave it a shot. One person deliberately separated them randomly, without looking at the charts.
If done randomly, I would expect six of the twelve charts to be in the correct pile. In fact there’s a 43% chance of getting six right, out of twelve. There’s a 24% chance of getting four or eight right, 4% chance of getting two or ten, and a 0.1% chance of getting none or all twelve correct. (You’re always getting an even number right because every stock you think is random results in a random you think is a stock.)
| Number right | % probability |
|---|---|
| 0 | 0.1 |
| 2 | 3.9 |
| 4 | 24.3 |
| 6 | 43.3 |
| 8 | 24.3 |
| 10 | 3.9 |
| 12 | 0.1 |
We decided ahead of time that if he got ten or twelve right, he would be able to claim that stocks look different than a random walk. If he got four, six, or eight right, then either they look the same or he can’t tell the difference. If he got none or two, then they’re different but he’s got it backwards.
Here are the results. The day-trader is person V, who spent about ten minutes sorting the twelve charts. Persons W, X, and Y looked briefly at the charts. Person Z picked randomly without looking at the charts. The green and red colorsbold and normal represent correct and incorrect guesses, respectively.
| Chart | Symbol | V | W | X | Y | Z | Score |
|---|---|---|---|---|---|---|---|
| A | Random | ✓ | ✓ | 2 of 5 | |||
| B | SWY | ✓ | 1 of 5 | ||||
| C | YHOO | ✓ | ✓ | 2 of 5 | |||
| D | IBM | ✓ | ✓ | 2 of 5 | |||
| E | Random | 0 of 5 | |||||
| F | AIG | ✓ | ✓ | ✓ | 3 of 5 | ||
| G | Random | ✓ | ✓ | 2 of 5 | |||
| H | CIT | ✓ | 1 of 5 | ||||
| I | Random | ✓ | ✓ | ✓ | 3 of 5 | ||
| J | Random | ✓ | ✓ | 2 of 5 | |||
| K | Random | ✓ | 1 of 5 | ||||
| L | MMM | ✓ | 1 of 5 | ||||
| Score | 4 of 12 | 2 of 12 | 2 of 12 | 6 of 12 | 6 of 12 |
The person who picked randomly got half of them right, unsurprisingly. So did another person who looked at the charts briefly. The day-trader did slightly worse than average, but still within the reasonable bounds of randomness. Surprisingly, though, two people did so badly that they imply that there is indeed a difference between stocks and a random walk. There was only a 4% chance of them getting so few right.
The right-most column shows the number of correct guesses for a given graph. Graphs E, K, and L managed to fool all four people who looked at them. (Person Z wasn’t looking.) The graphs are shown at the bottom of this page.
So what did we learn? I’m not sure we learned much. One could argue that I removed too much information from the stock data. (I graphed only opening prices, not close, low, or high.) I didn’t include any information about events, such as quarterly reports.
What I was really trying to show was that it’s not possible to reliably make money from day trading because it’s akin to trying to predict a random walk. I’m not sure that I’ve proven that. Just because it’s indistinguishable from a random walk after the fact doesn’t mean that the path of the walk couldn’t have been predicted.
I could repeat the experiment with two changes: adding candlestick marks for low, high, open, and close; and not normalizing vertically. That’s more like what a day trader would see.
But perhaps comparing to randomness is irrelevant. Maybe I should pick a real stock’s historical period, hide the last 10%, and ask people to predict the last 10% based on the first 90%. I may have to add various information about price/equity ratio and whatnot. It’s getting complicated. Or maybe I just should read Fooled by Randomness, which will just point me to the studies that have done all this already.
(Update 9/10/2009: I’ve now read the book and he doesn’t cover this specifically. I highly recommend the book, though.)
Below are the graphs along with some information about them. You can also download the Python script and stock data that were used to make the graphs: make_graphs.py, AIG.csv, CIT.csv, IBM.csv, MMM.csv, SWY.csv, and YHOO.csv.
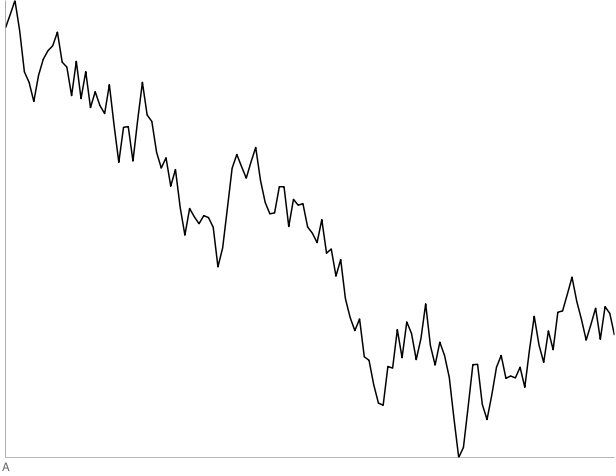
A: 130-point random walk. Two out of four people thought this was a stock.
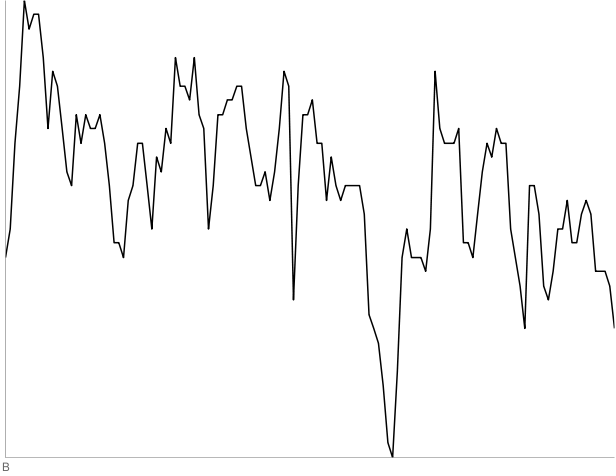
B: 130 days of SWY starting May 22, 1991. Three out of four people thought this was a random walk.
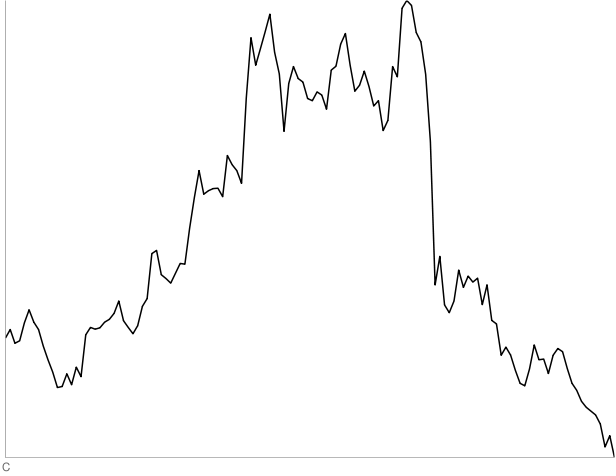
C: 130 days of YHOO starting September 7, 2005. Two out of four people thought this was a random walk.
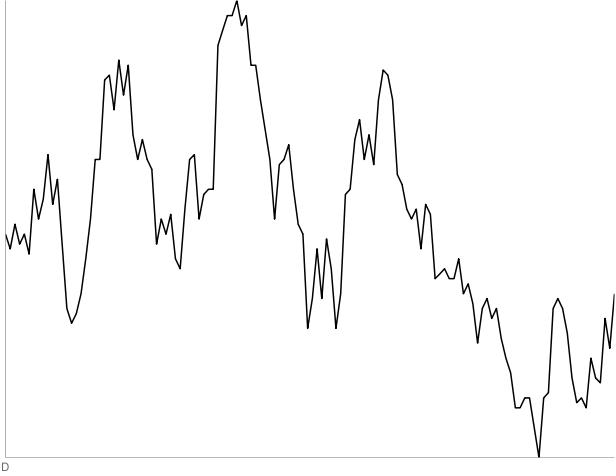
D: 130 days of IBM starting September 10, 1980. Three out of four people thought this was a random walk.
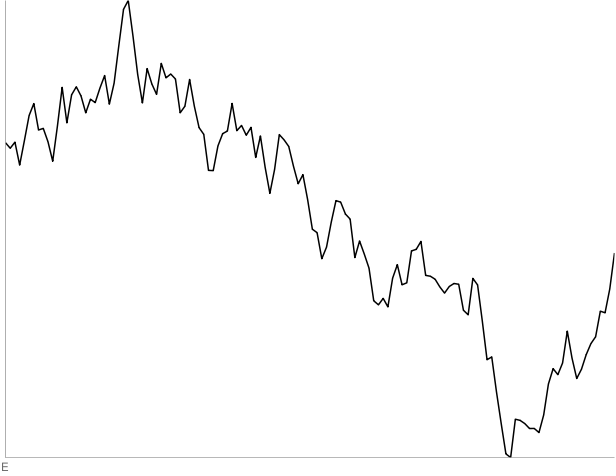
E: 130-point random walk. All four people thought this was a stock.
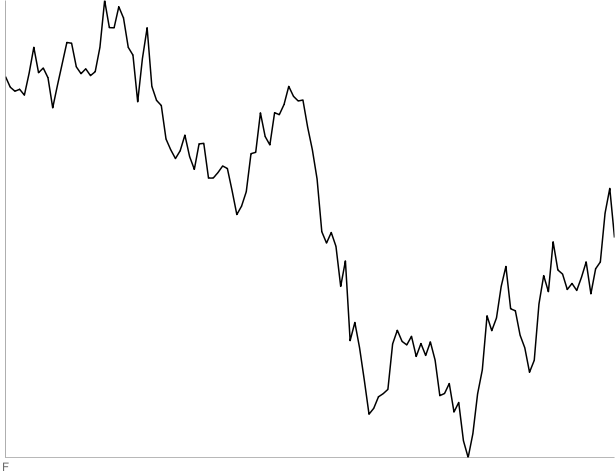
F: 130 days of AIG starting October 18, 2002. Two out of four people thought this was a random walk.
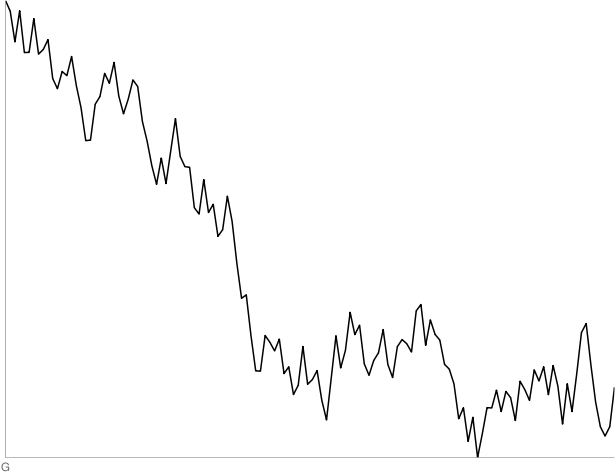
G: 130-point random walk. Three out of four people thought this was a stock.
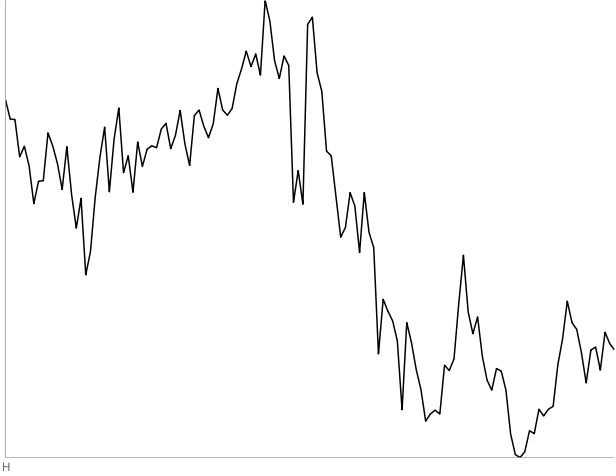
H: 130 days of CIT starting June 19, 2008. Three out of four people thought this was a random walk.
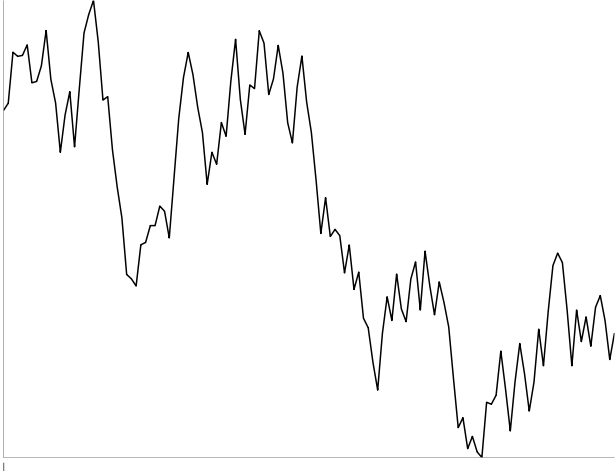
I: 130-point random walk. One out of four people thought this was a stock.
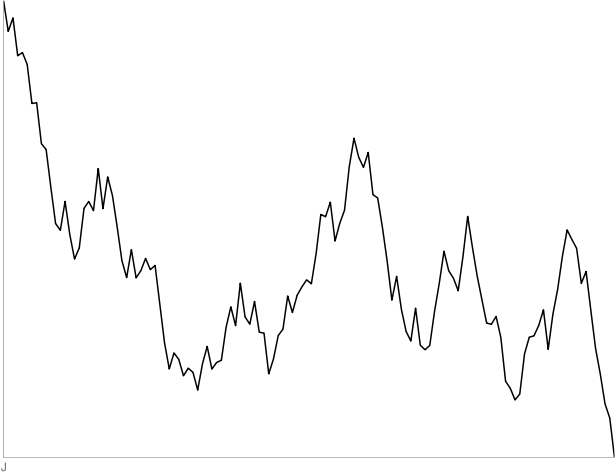
J: 130-point random walk. Three out of four people thought this was a stock.
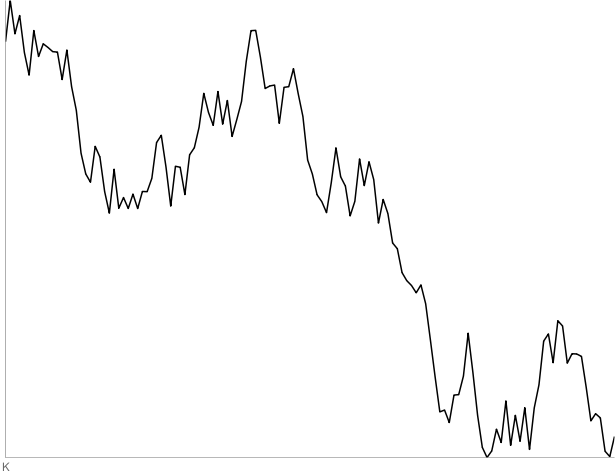
K: 130-point random walk. All four people thought this was a stock.
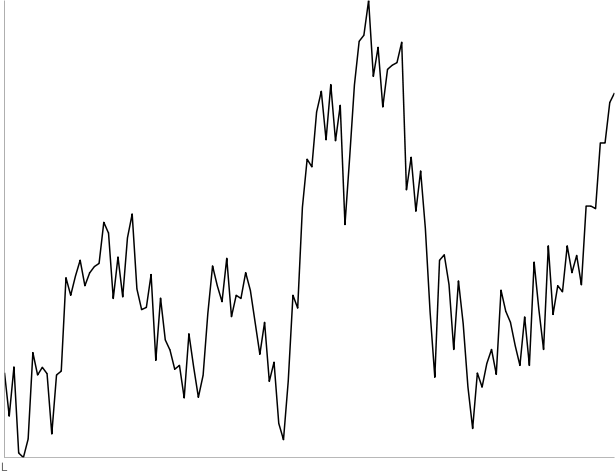
L: 130 days of MMM starting December 13, 2002. All four people thought this was a random walk.